Posts

Step-by-Step Guide to Using TOPN in Power BI for Dynamic Data Analysis

  DAX Function: TOPN with CALCULATE The TOPN function is one of the most powerful DAX functions for ranking and filtering data in Power BI. Combined with CALCULATE, it can be used to create dynamic, insightful measures. Below is an example of how to use TOPN with CALCULATE to find the top N items based on a certain criterion. Scenario Suppose you have a sales dataset and you want to calculate the total sales of the top 5 products by revenue. This measure will dynamically adjust based on any filters applied in your report (e.g., date, region, etc.). Function Syntax TOPN(<N_value>, <Table>, <OrderBy_Expression>[, <Order>[, <OrderBy_Expression> [, <Order>]]…]) <N_value>: The number of top rows to return. <Table>: The table to evaluate. <OrderBy_Expression>: The expression to order by. <Order>: Optional. Specifies the order direction (ASC for ascending, DESC for descending). Default...
How to clean up the log problem? PowerBIReportServerDB_log.ldf Clean up

PowerBIReportServerDB_log.ldf Clean up  Step 1: Shrink the Log File Manually Back Up the Transaction Log: Before shrinking the log file, perform a transaction log backup. This ensures that you have a safe recovery point. Run the following SQL command in SQL Server Management Studio (SSMS): Sql Code BACKUP LOG PowerBIReportServerDB TO DISK = 'C:\Backup\PowerBIReportServerDB_LogBackup.bak'; Shrink the Log File: After the backup, you can shrink the log file to reduce its size: Sql Code USE PowerBIReportServerDB; DBCC SHRINKFILE (PowerBIReportServerDB_log, 1024); -- Shrinks the log file to 1GB Note: Adjust the size as needed. This command reduces the log file size to 1GB. Set Recovery Model to Simple (Optional): If you don’t need point-in-time recovery, consider switching the database to Simple Recovery Model . This model automatically reclaims log space to keep the ...

Solving the issue of "The UseRelationship() and CrossFilter() function may not be used when querying 'Table' because it is constrained by row-level security."

 Solving the issue of "The UseRelationship() and CrossFilter() function may not be used when querying 'Table' because it is constrained by row-level security." Error Statement, Problem, and Solution: Error Statement: The error faced in the original scenario was related to the usage of USERELATIONSHIP function within row-level security constraints, leading to the error "The UseRelationship() and CrossFilter() function may not be used when querying 'Table' because it is constrained by row-level security." Problem: The error prevented the usage of USERELATIONSHIP within row-level security constraints, impacting the ability to establish relationships between tables for filtering purposes in certain contexts. Solution: To overcome the error and achieve the desired filtering based on dates without relying on USERELATIONSHIP, the DAX expression utilizes the TREATAS function along with ALL('Date'). This approach establishes a virtual relationship ...

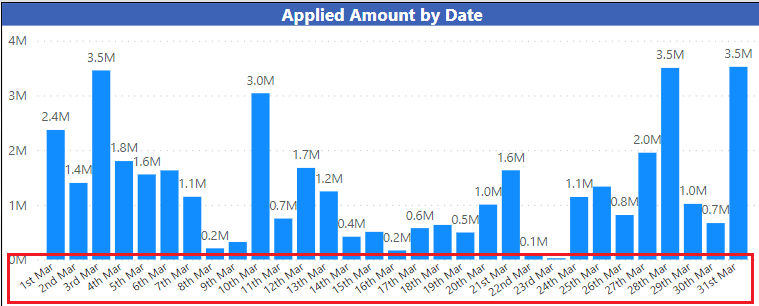
Making Dates Pop in Power BI: Adding Day Suffixes

Image
Making Dates Pop in Power BI: Adding Day Suffixes Problem Statement: Have you ever wanted to display dates in your Power BI reports with a little extra flair? By default, Power BI offers some formatting options, but they can be limited. One common request is to add suffixes like "1st," "2nd," "3rd," or "4th" to the day of the month. Achieving this can be tricky, but fear not – we've got a solution! Dax Formula: DayFormatted =  VAR DayNumber = DAY(DimDate[CalendarDate]) VAR Suffix =     SWITCH(         TRUE(),         DayNumber = 1 || DayNumber = 21 || DayNumber = 31, "st",         DayNumber = 2 || DayNumber = 22, "nd",         DayNumber = 3 || DayNumber = 23, "rd",         "th"     ) RETURN     CONCATENATE(CONCATENATE(CONCATENATE(DayNumber, Suffix), " "), FORMAT(DimDate[CalendarDate], "mmm")) Result: Explanation: Here's how it works in simple terms: Gett...

Sorting Day/Month/Year Column in Power BI

 Sorting Day/Month/Year Column in Power BI  Problem: When visualizing dates in Power BI or Excel, sorting them correctly can be a challenge, especially when you want to sort them by day within each month and across months. This becomes particularly tricky when filtering by year, as the sorting needs to consider both the day, month, and year components of the date. Solution: To address this sorting challenge, we can leverage a calculated column in Power BI or Excel that calculates a sorting value for each date. By assigning weights to the year, month, and day components of the date, we can ensure that the dates are sorted correctly in all scenarios. Step-by-Step Solution: Extract Day, Month, and Year Components: Extract the day component from the date. Extract the month component and multiply it by a significant weight. Extract the year component and multiply it by a weight if a specific year is selected. Calculate Sorting Value: Combine the weighted components to create a sort...

Dynamically Changing Text Fields in Power BI Using DAX

  Dynamically Changing Text Fields in Power BI Using DAX Introduction: In Power BI, dynamic reporting is crucial for providing users with insights that adapt to their selections and filters. One common requirement is to dynamically change text fields based on user selections, such as switching between "Year-to-Date" (YTD) and "Month-to-Date" (MTD) labels depending on the chosen time frame. In this blog post, we'll explore how to achieve this using DAX (Data Analysis Expressions) in Power BI. Solution Overview: We'll create a measure instead of a calculated column in our date table that determines whether it's YTD or MTD based on the user's selections. This approach ensures that the label dynamically updates as users interact with the report. Step-by-Step Guide: 1. Create a Measure: Begin by navigating to your date table in Power BI and creating a new measure. This measure will hold the dynamic label for YTD and MTD. 2. Write the DAX Formula: In t...

Power BI Realtime scenarios

  Power BI Realtime scenarios Problem1: You have two tables in Power BI: Table1 and Table2. Table1 contains data with columns IB (Identifier), Date, and EmpID (Employee ID). Table2 contains data with columns EmpID and Date. You want to bring the IB values from Table1 into Table2, matching them based on EmpID and Date. However, you cannot create a direct relationship between the tables, and Table2 contains future dates. You need to copy the IB values to future dates in Table2 based on the latest available data up to each date. Solution: To achieve this, you can create a calculated column in Table2 using Data Analysis Expressions (DAX) in Power BI. This calculated column will look up the latest available IB value for each EmpID and date in Table2, considering only the dates up to and including the current date. Sample Data: Table1 IB Date EmpID SA123 3/1/2023 1 SA231 3/1/2023 1 SA123 4/1/2023 1 SA231 5/1/2023 1 SA345 6/1/2023 1 Table2 EmpID Dat...