Posts

Showing posts from January, 2024

Week Number Calculation for each month

Understanding DAX Week Number Calculation with Conditional Logic Dax:  Week_num =     IF(         'Date'[WeekDayName] in {"Sat", "Sun"},         BLANK(),         WEEKNUM('Date'[Date], 2) -         WEEKNUM(EOMONTH('Date'[Date], -1) + 1, 2) + 1     ) Explanation: In Power BI and other Microsoft data analysis tools, understanding date calculations is crucial for accurate reporting and visualization. One common requirement is to calculate week numbers, but often, we need to exclude weekends from the count. The provided DAX function accomplishes this task efficiently. Introduction: Date-based analysis often involves tracking data by week, but the definition of a week may vary depending on business requirements. This DAX function not only computes week numbers but also intelligently handles weekends, ensuring that week counts accurately reflect working days. Function Overview: The  We...
Current Month or Current Year or Current Day as a Default Selection

Current Month or Current Year or Current Day as a Default Selection To allow users to always select the current month, year, or day, follow the instructions Dax Example CurrentMonth = IF( 'Calendar Table'[Month] = FORMAT(TODAY(), "mmm"), "CurrentMonth", 'Calendar Table'[Month] ) For the year, simply replace the "Month" column with the "Year" column, and similarly for the day or week, follow the same process. Feel free to ask any questions about Power BI. I am here to help you. Happy Learning! 😊

Time Intelligence Dax Functions - Power BI

Time Intelligence Dax Functions - Power BI TOTALYTD: Calculates the year-to-date total for a given expression. Example:  Total Sales YTD = TOTALYTD(SUM('Sales'[Amount]), 'Date'[Date]) TOTALQTD: Calculates the quarter-to-date total for a given expression. Example:  Total Sales QTD = TOTALQTD(SUM('Sales'[Amount]), 'Date'[Date]) TOTALMTD: Calculates the month-to-date total for a given expression. Example:  Total Sales MTD = TOTALMTD(SUM('Sales'[Amount]), 'Date'[Date]) DATESYTD: Returns a table that contains all dates from the beginning of the year up to the specified date. Example: Sales YTD = CALCULATE(SUM('Sales'[Amount]), DATESYTD('Date'[Date])) DATESQTD: Returns a table that contains all dates from the beginning of the quarter up to the specified date. Example: Sales QTD = CALCULATE(SUM('Sales'[Amount]), DATESQTD('Date'[Date])) DATESMTD: Returns a table that contains all dates from the beginning of the mon...

Power BI Scenario Based Interview Questions and Answers

Power BI Scenario Based Interview Questions and Answers 1.Scenario: You have been tasked with creating a sales dashboard for a retail company. What visualizations would you include, and how would you ensure the dashboard provides actionable insights? Answer: I would include visualizations such as sales trends over time, top-selling products, geographic sales distribution, and customer segmentation. To ensure actionable insights, I would add interactive filters for date ranges, product categories, and customer segments, allowing users to drill down into specific details and identify opportunities for improvement. 2.Scenario: The CEO of your company wants a real-time dashboard to monitor key business metrics. How would you design and implement such a dashboard using Power BI? Answer: I would utilize Power BI streaming datasets to capture real-time data from various sources such as IoT devices or transaction systems. Then, I would design visuals to display metrics like sales revenue...

Power BI Interview Questions and Answers for Experience.

Power BI Interview Questions and Answers for Experience.  1) What is the difference between Power BI and other BI tools? Answer: Power BI is known for its integration with Microsoft products and ease of use. Unlike some BI tools, it allows for self-service analytics and is scalable from small to enterprise-level solutions. 2) Explain the importance of the star schema in Power BI data modeling. Answer: The star schema is crucial for optimizing query performance in Power BI. It involves creating a central fact table connected to dimension tables, reducing the complexity of queries and improving response times. 3) How does the Power BI data model handle many-to-many relationships? Answer: Power BI uses a bridge table or an intermediary table to handle many-to-many relationships. This table resolves the ambiguity by breaking down the relationship into two one-to-many relationships. 4) What is the role of the Power BI Performance Analyzer tool? Answer: The Power BI Performance Analy...

Power BI Interview Questions & Answers for Freshers

Power BI Interview Questions & Answers for Freshers  1) What is Power BI? Answer: Power BI is a business analytics service by Microsoft that provides interactive visualizations and business intelligence capabilities with an interface simple enough for end-users to create their own reports and dashboards. 2) Explain the components of Power BI. Answer: Power BI consists of three main components: Power BI Desktop (for creating reports and dashboards), Power BI Service (for sharing and collaborating on reports in the cloud), and Power BI Mobile (for accessing reports on mobile devices). 3) What is Power Query? Answer: Power Query is a data connection technology that enables you to discover, connect, combine, and refine data across a wide variety of sources. 4) Explain DAX in Power BI. Answer: DAX (Data Analysis Expressions) is a formula language used in Power BI for creating custom calculations in tables and columns. It is similar to Excel formulas but is designed for use in Power ...

Calculate Sales for Last Year Month to date

Sameperiodlastyear till to date based on selection in year and month selection Problem:  If the current year and month are selected, sales data from the same period of the previous year up to the current date is needed. For instance, if it's March 2024, you'd require sales data from March 2023 up to today's date. If the selection is for a different year and month, such as January 2023, you need the entire sales data for January 2022. Solution:  For this scenario you need to create Three Dax Measures Measure 1 = (This measure is to calculate current month sales till the date) CALCULATE( SUM(CST[Total Financed Amount]), SAMEPERIODLASTYEAR( DATESYTD('Calendar Table'[Date]) ), FILTER( ALL('Calendar Table'), 'Calendar Table'[MonthNum] = MONTH(NOW()) && DAY('Calendar Table'[Date]) <= DAY(NOW()) ) ) Explanation: CALCULATE : This is a DAX function used to modify or filter the context for a calculation. It can apply additional filters to a ...

Create Calendar Table with Power Query

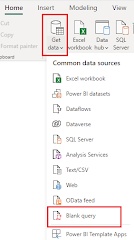
Image
How to create calendar table by using power query Step 1: Click on Get Data Step 2: Select Blank Query Step 3: Click on Advance Editor in the Home Tab of Power Query Editor Step 4: Remove the syntax and paste below mentioned syntax Syntax: Paste below mentioned syntax let     StartDate = #date(2024, 1, 1),     EndDate = #date(2024, 12, 31),     NumberOfDays = Duration.Days(EndDate - StartDate),     DateList = List.Dates(StartDate, NumberOfDays+1, #duration(1, 0, 0, 0)),     TableFromList = Table.FromList(DateList, Splitter.SplitByNothing()) in     TableFromList If you want a calendar for a different range, modify the StartDate and EndDate variables accordingly. Step 5: Click "Done" in the Advanced Editor. Step 6: You may want to add additional columns to your calendar table, such as Year, Month, Quarter, Day of Week, etc. Here's an example of how to add a Year column: In Power Query Editor, select the "Date" column. Go to th...

Create Calendar Table in Power BI using DAX Function

 Calendar Table using Dax Syntax: CalendarTable = ADDCOLUMNS ( CALENDAR (DATE(2024, 1, 1), DATE(2024, 12, 31)), "Year", YEAR([Date]), "MonthNumber", MONTH([Date]), "MonthName", FORMAT([Date], "MMMM"), "Quarter", QUARTER([Date]), "DayOfWeek", WEEKDAY([Date]), "DayOfMonth", DAY([Date]), "WeekdayName", FORMAT([Date], "dddd"), "IsWeekend", IF( OR(WEEKDAY([Date]) = 1, WEEKDAY([Date]) = 7), TRUE(), FALSE()), "IsHoliday", IF( OR( MONTH([Date]) = 1 && DAY([Date]) = 1, MONTH([Date]) = 7 && DAY([Date]) = 4), TRUE(), FALSE()) ) Explanation: CALENDAR (DATE(2024, 1, 1), DATE(2024, 12, 31)) Creates a table with a single column containing dates from January 1, 2024, to December 31, 2024. ADDCOLUMNS ( Adds new columns to the table created by the CALENDAR function. "Year", YEAR([Date]), Adds a column named "Year" that...

Distinctcount and Countrows in DAX

 When to use Distinctcount and Countrows Function in DAX Distinctcount: Counts the number of distinct values in a column. Expression: Count_Of_EmpID =CALCULATE(     DISTINCTCOUNT('Table'[EmpID]),     ALLEXCEPT('Table', 'Table'[EmpID]) ) Explanation: This DAX expression calculates the count of distinct employee IDs in the 'Table' table, excluding any filters on other columns. The ALLEXCEPT function removes all filters from the 'Table' table except for the EmpID column, ensuring that the count is performed on all rows in the table. If we don't want to count EmpID whose having as 0 then follow below Expression Count_Of_EmpID=CALCULATE(     DISTINCTCOUNT('Table'[EmpID]),     ALLEXCEPT('Table', 'Table'[EmpID]),     'Table'[EmpID] <> 0 ) This expression adds an additional filter to the ALLEXCEPT function, excluding rows where the EmpID column is equal to 0. As a result, the count of distinct employee IDs will o...